In 2023, butter traded at $3.50 a pound on commodity markets — its highest price since 1965. By mid-2026, that same pound of butter costs roughly $1.65, about 31% below its five-year average (USDA Agricultural Marketing Service, Dairy Market News, 2026). That collapse in butterfat, the single most expensive ingredient in a carton of ice cream, has pushed the average price of a half-gallon container below $6 for the first time in two years, down from an average of $6.26 across 2024 and 2025, according to Bureau of Labor Statistics data.
That’s a genuinely unusual headline in a grocery aisle where shrinkflation and sticky prices have dominated the last several years. It matters now because the freezer aisle offers a clean natural experiment: a specific, trackable commodity crashed, and economists, retailers, and students of price theory can watch in close to real time whether that cost relief actually reaches the consumer, gets absorbed by manufacturers rebuilding margin, or gets offset by rising costs elsewhere in the same product. This piece argues that falling butterfat prices are producing real, measurable relief in one narrow grocery category, but that relief is partial, uneven across brands and package sizes, and vulnerable to being reversed by tariff-driven cocoa and sugar costs, a restructured ice cream industry, and a demand shift tied to GLP-1 weight-loss medications.
What follows: the dairy supply glut behind the butterfat crash, what the retail CPI data shows so far, how a decade of shrinkflation complicates the “prices are falling” narrative, a comparative look at how another food brand held its price line through inflation, and where this relief is most likely to stall.
Background and Context
Butterfat (also called milkfat) is the fat component of milk and cream, and it’s the ingredient that gives ice cream its richness and mouthfeel — a “premium” or “regular” ice cream typically requires a minimum 10% milkfat content by US federal standard, with many super-premium brands running well above that floor. Butterfat is priced on commodity markets primarily through CME (Chicago Mercantile Exchange) spot butter prices, which serve as the dairy industry’s benchmark for the value of milkfat, and through USDA Class II and Class IV milk component pricing, which sets minimum prices processors pay farmers for the fat used in products like ice cream, cream, and butter.
The current price collapse traces to a straightforward supply-and-demand story. Through November 2025, US dairy cows produced more than 9.1 billion pounds of butterfat — the most ever recorded for that period, and 4.7% more than the same stretch in 2024. Fat markets fell more than 40% between September 2025 and February 2026 as that supply built up faster than demand for high-fat products like ice cream and cream cheese could absorb it (DairyReporter, 2025–2026). Part of the oversupply is structural rather than cyclical: the industry added an estimated 10 billion pounds of annual cheese-processing capacity since 2023, much of it financed through 20-year USDA Rural Development loans that incentivize plants to run near full capacity regardless of near-term price signals — meaning cream, a byproduct of cheese production, keeps flooding the market even as prices fall. This kind of commodity whiplash isn’t unfamiliar to grocery shoppers; our earlier coverage of how El Niño-driven weather disruptions pushed grocery prices higher documented the opposite side of the same volatility.
Core Analysis
The Butterfat Crash, Quantified
Claim: The scale of the butterfat price decline is large enough, and sustained enough, to constitute a genuine structural relief event rather than short-term noise.
Evidence: CME spot butter fell from its 2023 record of $3.50 per pound to $2.44 by August 1, 2025, then dropped sharply to $1.50 by mid-November 2025 before stabilizing in the $1.65-to-$2.00 range through mid-2026. USDA’s Class II butterfat price — the regulated benchmark tied to products like ice cream — sat at $1.6970 per pound in late June 2026. On the consumer side, the average half-gallon ice cream container fell below $6 in the most recent BLS reading, versus a $6.26 average sustained through 2024 and 2025, with the overall Consumer Price Index showing butter down roughly 9% year-over-year.
Interpretation: A 31%-below-average commodity price, sustained across multiple quarters rather than a single data point, is a meaningfully different signal than the kind of short-lived commodity spike-and-recovery cycles common in agricultural markets. Combined with rising cow inventories and milk production forecasts for both 2026 and 2027, the data suggests the current low-butterfat environment has more durability than a temporary glut.
Limitation: Commodity dairy markets are historically volatile and sensitive to weather, feed costs, and herd culling decisions; a single supply shock — avian influenza in dairy herds, a drought affecting feed costs, or a rapid contraction in processing capacity — could reverse the trend faster than it built.
From Farm Price to Shelf Price: Does the Relief Actually Pass Through?
Claim: Cost relief at the commodity level is reaching consumers in the ice cream category, but incompletely and unevenly.
Evidence: The BLS half-gallon average price decline (from $6.26 to sub-$6.00) roughly tracks the direction, if not the full magnitude, of the underlying butterfat price collapse — a rough gap consistent with manufacturers passing through some, not all, of the input cost savings. Notably, CPI data for the same period shows other ice cream inputs, milk and sugar specifically, registering slight price increases even as butterfat cratered, meaning the net cost relief for a typical batch of ice cream is smaller than the butter price move alone would suggest.
Why Full Pass-Through Rarely Happens
Economic research on cost pass-through consistently finds that price declines transmit to consumers more slowly and incompletely than price increases — a pattern sometimes called price stickiness or asymmetric pass-through. Manufacturers facing years of margin compression from the 2022–2023 inflation spike have a straightforward incentive to bank some of the current input relief as margin recovery rather than pass through 100% of the savings, particularly in a product category where consumers rarely comparison-shop ice cream prices per ounce with the same precision they apply to staples like eggs or gasoline.
Limitation: This analysis relies on national average CPI figures, which smooth over significant regional and brand-level variation; premium and private-label ice cream brands likely show different pass-through rates, and this piece does not have brand-level pricing data to confirm that split precisely.
The Shrinkflation Complication
A full accounting of “value” in the ice cream aisle can’t stop at price per container, because the container itself has been shrinking for over a decade — a dynamic we detailed in our breakdown of shrinkflation versus skimpflation. Major ice cream brands moved from a true half-gallon (64 ounces) down to 56 ounces, then 48 ounces — a 25% reduction in product — while holding or raising the sticker price during that transition. Some brands have continued shrinking since: 46-ounce cartons are now common, and pints once holding a full 16 fluid ounces have in some cases dropped to 14.
Why This Matters for the “Relief” Narrative
If a half-gallon container has effectively lost close to a quarter of its volume over the past decade while its price held steady or rose, then a modest nominal price decline in 2026 doesn’t fully restore prior value — it partially offsets a cost increase that had already been delivered through package downsizing rather than sticker price. A rigorous reading of “prices are falling” needs a price-per-ounce comparison against a historical baseline, not just a comparison of today’s sticker price to last year’s.
Counterpoint: It’s also possible that falling input costs could pressure manufacturers to reverse course on package sizes rather than cut prices further, since restoring container size is a more visible, marketing-friendly way to signal value to consumers than a price cut that many shoppers won’t notice. Whether relief shows up as bigger containers or lower prices per ounce is an open question this data can’t yet answer.
Is the Category’s Underlying Demand Actually Shrinking?
A more skeptical read of the “relief” framing points to the demand side rather than costs. Roughly 18% of US adults were using a GLP-1 weight-loss medication as of spring 2026, up from about 14% in 2025, and households using these medications are projected to represent 35% of all food and beverage sales by 2030 (Food Dive, 2026). GLP-1 users, on average, shift toward smaller portions and away from calorie-dense indulgence categories — a demand headwind for a high-fat, high-sugar product like traditional ice cream, independent of what’s happening to input costs.
On this view, falling butterfat prices could partly reflect softening demand for high-fat dairy products generally (ice cream and cream cheese both cited as weak-demand categories in the dairy oversupply data above), not just an oversupply of milk. If that’s right, the “relief” consumers are seeing is entangled with a category facing longer-term demand pressure, which complicates any assumption that current low prices represent a stable new equilibrium rather than a temporary byproduct of a shrinking market working through excess inventory. Industry responses vary: some ice cream makers are leaning into “permissible indulgence” positioning and premiumization to defend volume, while executives at more novelty-focused brands argue their categories are more insulated because they sell an occasion or experience rather than a staple dessert.
A Cross-Sector Comparison: Holding the Price Line Elsewhere in Grocery
Ice cream’s price story sits inside a broader pattern of how food and beverage companies have handled input cost volatility since 2022. Not every category has responded the same way. Arizona Iced Tea famously held its 99-cent can price for decades by absorbing cost increases elsewhere in its business rather than passing them to consumers — a strategy we examined in how Arizona Iced Tea defied inflation. That example is a useful counterweight to the ice cream story: it shows that pass-through behavior, in either direction, is a business choice shaped by brand strategy and competitive positioning, not a mechanical function of input costs alone. Ice cream manufacturers facing a butterfat windfall have more strategic latitude than the “prices simply reflect costs” framing implies — and the recently completed restructuring of the industry adds another variable. Unilever completed the spinoff of its ice cream division, including Magnum, Wall’s, and Ben & Jerry’s, into the independently traded Magnum Ice Cream Company in December 2025, creating the world’s largest standalone ice cream business. A newly independent public company under pressure to demonstrate margin improvement to its own shareholders has a different incentive calculus around passing through commodity savings than a division embedded inside a larger conglomerate.
Data and Evidence Layer
Methodology note: Commodity-level figures are drawn from USDA Agricultural Marketing Service Dairy Market News weekly reports and CME spot butter pricing as reported through trade press; retail-level figures are drawn from Bureau of Labor Statistics Consumer Price Index data for ice cream and butter. Because CME spot prices, USDA Class II regulated prices, and BLS retail CPI data are collected on different timelines and methodologies, the figures below should be read as directionally consistent rather than perfectly reconcilable to the decimal point — a limitation worth noting for anyone citing this as a single unified series. For a primer on how CPI itself is constructed, see our explainer on what the Consumer Price Index measures and how.
| Period | CME Spot Butter Price | vs. 5-Year Average |
|---|---|---|
| 2023 peak | $3.50/lb | Highest since 1965 |
| August 2025 | $2.44/lb | Declining |
| November 2025 (trough) | $1.50/lb | Sharp low |
| Mid-2026 (current) | ~$1.65/lb | ~31% below average |
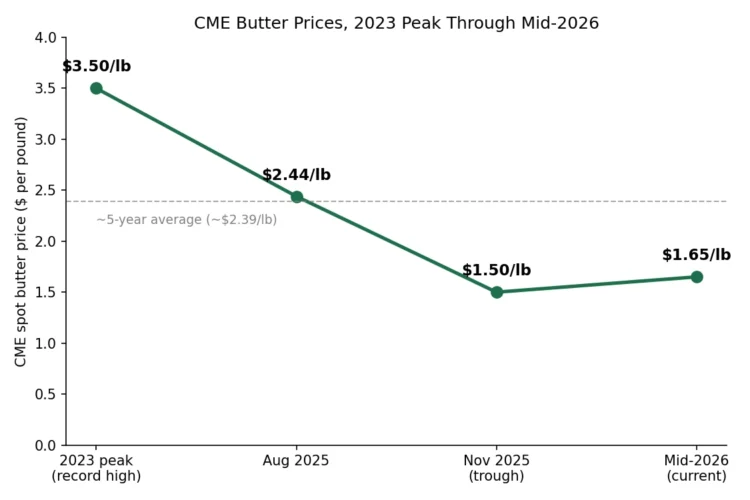
Line chart titled “CME butter prices, 2023 peak through mid-2026,” showing butter falling from $3.50/lb in 2023 to $2.44/lb in August 2025, bottoming at $1.50/lb in November 2025, and settling near $1.65/lb in mid-2026, with a dashed line marking the roughly $2.39/lb five-year average.
On the retail side, BLS CPI data shows the average half-gallon ice cream container at $6.26 across 2024–2025, falling below $6.00 in the most recent reading — while milk and sugar, two other core ice cream inputs, registered slight increases over the same window, illustrating that the relief is concentrated in butterfat specifically rather than reflecting a broad-based decline in ice cream production costs.
Implications
The clearest practical implication is that grocery price relief in 2026 is highly category-specific rather than a broad trend, and ice cream is a useful case study precisely because its single dominant cost input is publicly tracked on commodity exchanges in a way most grocery products aren’t. That specificity is worth remembering the next time a broad claim about “grocery prices coming down” circulates, since it typically masks wide variation by category — a dynamic our piece on tariffs, inflation, and what’s ahead for consumer spending explores at the macro level.
For manufacturers, the pass-through gap between falling farm-level butterfat costs and smaller retail price declines is itself a quotable finding: cost relief upstream does not translate one-to-one into consumer price relief, and the margin captured in between is a legitimate and measurable business decision, not an inevitability.
For policymakers and trade analysts, the ice cream case also illustrates how a single-category cost story can be partially offset by unrelated policy: tariffs of roughly 15% on processed cocoa imports pushed cocoa liquor, powder, and butter costs up about 18.2% since January 2025, and a 20% tariff on refined sugar imports from Mexico has pressured sugar costs — meaning any ice cream flavor built around chocolate or heavy sweetening may see its butterfat savings partly offset by tariff-driven cost increases elsewhere in the recipe.
Counterpoints and Limitations
This analysis has real boundaries. It relies on national-average CPI and CME/USDA commodity data, which cannot capture brand-level, regional, or private-label pricing variation — a premium pint and a store-brand tub likely show meaningfully different pass-through behavior that this piece doesn’t isolate. The claimed “31% below five-year average” and specific price points are drawn from trade press summaries of USDA and CME data rather than a single audited primary dataset, and dairy commodity reporting can be revised after initial release.
The GLP-1 demand argument is directional and inferential: while adoption rates and category-level indulgence-spending concerns are documented, this piece does not have ice-cream-specific sales volume data isolating GLP-1 users as a distinct causal factor in the current butterfat glut, and reasonable analysts could weight supply-side oversupply factors much more heavily than demand-side shifts. Finally, this piece focuses on packaged retail ice cream and does not examine foodservice or scoop-shop pricing, which follow a different cost and margin structure entirely.
Conclusion
The evidence supports a specific, bounded claim: butterfat costs have fallen sharply and durably enough to produce real, measurable price relief in the retail ice cream category, but that relief is partial, arriving unevenly across brands, potentially offset by rising cocoa and sugar costs elsewhere in the recipe, and layered on top of a decade of container shrinkage that a simple sticker-price comparison doesn’t fully account for. The freezer aisle is a genuine bright spot in an otherwise sticky grocery inflation picture, but it’s a narrower and more fragile bright spot than “ice cream prices are falling” alone suggests.
The open question worth watching through the rest of 2026: will the newly independent Magnum Ice Cream Company and its competitors use this butterfat windfall to rebuild package sizes and win back price-conscious shoppers, or will they bank the margin recovery after several difficult inflationary years — and will GLP-1-driven demand softening make that decision for them regardless of what commodity markets do next?
FAQ
Why are ice cream prices falling in 2026?
Ice cream prices are falling because butterfat, the most expensive ice cream ingredient, has dropped roughly 31% below its five-year average due to a US dairy supply glut. The average half-gallon container price fell below $6 in 2026, down from a $6.26 average across 2024 and 2025.
What is causing the butterfat price crash?
US dairy cows produced record volumes of butterfat in 2025, driven partly by new cheese-processing capacity that generates cream as a byproduct. Supply outpaced demand for high-fat products like ice cream and cream cheese, pushing CME butter prices down from a 2023 peak of $3.50 per pound to around $1.65 by mid-2026.
Are all ice cream ingredients getting cheaper?
No. While butterfat costs have crashed, CPI data shows milk and sugar prices ticked up slightly over the same period, and tariffs on imported cocoa (about 18.2% higher since January 2025) and refined sugar have added cost pressure to chocolate and sweetened varieties specifically.
Is falling butterfat cost being fully passed on to consumers?
Not entirely. The retail price decline (from $6.26 to under $6.00 for a half-gallon) is smaller in percentage terms than the roughly 31%-below-average butterfat price drop, suggesting manufacturers are passing through some but not all of the input cost savings.