American dealers sold 247,226 new electric vehicles in the second quarter of 2026 — a figure that looks respectable until it’s set against the same quarter a year earlier, when sales ran 20.5% higher (Cox Automotive, 2026). This is the third straight quarter of year-over-year decline, triggered by the expiration of the federal $7,500 EV tax credit on September 30, 2025. Yet across that same stretch, General Motors, Ford, Hyundai, and Stellantis kept billions of dollars flowing into battery plants, next-generation platforms, and new nameplates — even after absorbing more than $50 billion in combined EV-related write-downs.
That contradiction is the real story of the US EV market in 2026: sales retreating, capital still committed. It matters beyond the auto beat, because it’s a live case study in how a subsidy-dependent technology market behaves once the subsidy disappears, and whether “demand” and “policy” can be pulled apart in the data. This article argues that the current downturn is a demand correction caused by the removal of a specific incentive, not evidence that electrification itself has stalled — and that automakers’ continued investment reflects longer-horizon bets on regulation, global competition, and falling battery costs that a single bad year of sales figures doesn’t capture.
What follows: how the tax-credit cliff produced the current numbers, what four quarters of sales data actually show, why manufacturers are recalibrating rather than retreating, the strongest counterargument to that claim, and how the US slowdown compares with accelerating EV adoption in Europe and China.
Background and Context
Electric vehicle (EV) is used here as an umbrella term covering battery electric vehicles (BEVs, which run entirely on a battery) and plug-in hybrids (PHEVs, which combine a battery with a gas engine). Cox Automotive and Kelley Blue Book, the primary data sources cited throughout this piece, report BEV and PHEV sales together as “EV” unless otherwise noted. A Zero-Emission Vehicle (ZEV) mandate is a state-level regulation requiring automakers to sell a rising percentage of ZEVs (BEVs, PHEVs, and hydrogen fuel-cell vehicles) as a share of total sales, enforced through tradable compliance credits rather than direct sales quotas on individual models.
The federal EV tax credit traces back to the 2022 Inflation Reduction Act, which offered up to $7,500 for qualifying new EV purchases or leases. The 2025 One Big Beautiful Bill Act repealed that credit effective September 30, 2025. The run-up to the deadline produced a classic pull-forward effect: August 2025 sales jumped almost 18% year-over-year as buyers rushed to lock in the discount before it vanished (NPR, 2025), and Q3 2025 sales hit an all-time record of 438,487 units. The credit’s removal was always going to produce a statistical cliff in Q4 — the only open question was how deep, and how long it would last.
That question sits inside a larger structural context that predates the tax credit fight: California’s Advanced Clean Cars II (ACC II) rule and the roughly 17 states plus Washington, D.C. that follow it — collectively about 40% of new US vehicle sales — require automakers to hit rising ZEV sales percentages regardless of federal tax policy, with penalties for missing targets running $10,000–$25,000 per deficient credit. That regulatory floor, more than any single tax credit, is central to understanding why manufacturers haven’t simply walked away from EV programs.
Core Analysis
The Post-Credit Demand Correction
Claim: The steep year-over-year sales declines since Q4 2025 are best read as a subsidy-withdrawal shock, not a collapse in underlying EV demand.
Evidence: The quarterly pattern is unusually clean for a real-world dataset. Q3 2025 hit a record 438,487 units as buyers front-loaded purchases before the credit expired. Q4 2025 sales cratered to roughly 234,000 units — down 36% year-over-year and 46% from the prior quarter — as pulled-forward demand left a hole (Cox Automotive, Q4 2025 report). Q1 2026 came in at 216,399 units, still down 27% year-over-year but only 7.8% below Q4 — a much shallower drop. Q2 2026’s 247,226 units were down 20.5% year-over-year but up 14.7% sequentially. In other words: the year-over-year comparisons look grim because they’re measured against a subsidy-inflated Q3 2025, but the sequential trend since the Q4 trough has been consistently positive.
Interpretation: A market in structural decline typically shows sales continuing to fall quarter over quarter. This market’s year-over-year figures are worsened by an artificially high 2025 baseline, while its quarter-over-quarter trend — the more diagnostic number for isolating current demand — has improved for two straight quarters. That pattern is more consistent with a market absorbing a subsidy shock than one in secular retreat.
Limitation: Two quarters of sequential recovery is not a trend line long enough to rule out a slower, longer-run decline. Average transaction prices remain elevated (new EVs averaged $57,245 in August 2025, roughly a $10,000–$15,000 premium over the average new vehicle), and if affordability doesn’t improve, the sequential bounce could flatten out again.
Automakers Are Recalibrating, Not Retreating
Claim: The headline write-downs at GM, Ford, and Stellantis represent a recalibration of pace and product mix, not an exit from electrification.
Evidence: Stellantis booked a $27 billion EV-related writedown, Ford took a $19.5 billion charge, and GM absorbed a $7.6 billion hit in late 2025 and early 2026 — a combined figure north of $50 billion across the Big Three (Yahoo Finance, 2026). GM idled its two Ultium Cells joint-venture battery plants in Warren, Ohio, and Spring Hill, Tennessee, for six months starting January 2026, affecting roughly 1,550 workers combined. Ford is converting its Kentucky battery factory to a grid-storage business serving utilities and data centers rather than shutting it outright.
The Hybrid Bridge Strategy
Both companies are redirecting capital toward hybrids and plug-in hybrids as an intermediate step: Ford is rebalancing toward hybrid trucks and SUVs, and GM is spending roughly $4 billion converting factories to build more hybrids and gas-powered vehicles alongside its EV lineup (CNBC, 2025). GM has publicly maintained that EVs remain its “North Star,” even while pushing back the timeline for its earlier all-EV pledges.
The Regulatory Floor Beneath the Pullback
ACC II compliance obligations don’t disappear when federal tax credits do. Starting in 2026, the rule requires 35% of new light-duty sales in adopting states to be ZEVs, scaling to 51% by 2028, 68% by 2030, and 100% by 2035. Missing those targets triggers per-credit penalties in the five-figure range. For automakers selling into California and the roughly 40% of the national market that mirrors its rule, abandoning EV development isn’t a cost-neutral option — it’s a trade of one financial exposure (unprofitable EV production) for another (ZEV credit deficits and potential corrective action plans).
The Case That This Time Really Is Different
A fair reading of the same facts supports a more pessimistic conclusion, and it deserves a direct hearing rather than a dismissal.
Skeptics point out that the pivot toward hybrids isn’t just a bridge strategy — it may be where consumer demand actually sits. Executives at Ford and GM have acknowledged, in effect, that federal and state policy — not organic consumer pull — was driving much of the EV growth curve through 2024 and 2025. If that’s true, then removing the federal credit didn’t just delay purchases, it revealed the market’s real size. On this view, the sequential Q1–Q2 2026 improvement is simply new product launches and price cuts propping up a smaller structural market, not a rebound toward the old trajectory.
There’s also real uncertainty about whether the regulatory floor holds. ACC II has faced legal challenges and political pressure to weaken enforcement, and a federal administration hostile to state-level EV mandates could pursue preemption. If the ZEV credit regime softens or is struck down, the main structural reason automakers cite for staying the course would weaken considerably. This is a genuinely open question, not a settled one, and it’s the biggest single risk to the “not out” thesis this article advances.
The Global Comparison: Why US Softness Isn’t a Global Signal
The US EV story looks different depending on where you’re standing. Global BEV sales rose to roughly 14 million units in 2025 from 11 million in 2024, and the International Energy Agency projects continued growth in 2026 toward roughly 23 million electric cars sold worldwide — about 28% of total car sales (IEA Global EV Outlook 2026). China accounts for roughly 51% of global EV sales, and Europe close to a third, leaving the US as a high-single-digit share of the global total.
Europe Is Accelerating, Not Retreating
Europe’s EV sales rose more than 26% year-to-date in 2026, pushing electric cars to around 28% of new sales, driven by tightened EU CO2 standards rather than a US-style tax credit. This is directly relevant to the ACC II debate: Europe shows that a regulatory-standards approach to EV adoption, decoupled from a direct consumer rebate, can sustain growth even as the US subsidy-driven model stalls.
China’s Domestic Slowdown, Global Export Surge
China’s own EV sales fell 13% in the first half of 2026 as Beijing wound down its trade-in subsidy scheme — a similar subsidy-withdrawal dynamic to the US, which somewhat undercuts the idea that the US decline is uniquely a policy failure. But Chinese EV exports more than doubled in Q1 2026 alone, as manufacturers redirected excess capacity abroad. Much of that export growth is landing in Europe and emerging markets — our earlier coverage of Chinese EVs reshaping Brazil’s auto market traces the same pattern in South America. The EU’s response — replacing blanket tariffs on Chinese EVs with a minimum-price mechanism starting in January 2026 — is itself a sign that European regulators expect Chinese EV competition to be a permanent feature of the market, not a passing wave (see our analysis of the EU-China EV subsidy talks).
The comparative picture, in short: the US decline is real but geographically isolated, driven by a specific and identifiable subsidy cliff, while the two largest EV markets in the world continue to grow or restructure around durable regulatory frameworks rather than direct purchase incentives.
Data and Evidence Layer
Methodology note: The quarterly sales and market-share figures below are synthesized from Cox Automotive/Kelley Blue Book quarterly EV sales reports, cross-checked against Alliance for Automotive Innovation “Get Connected” quarterly data where available. Because different data providers use slightly different BEV/PHEV inclusion criteria and estimation methods, market-share figures can vary by half a percentage point or more between sources; where a discrepancy existed, the Cox Automotive/KBB figure was used for consistency across the full four-quarter series.
| Quarter | US EV Units Sold | YoY Change | QoQ Change | EV Share of New-Vehicle Sales |
|---|---|---|---|---|
| Q3 2025 | 438,487 (record) | +29.6% | +40.7% | 10.5% |
| Q4 2025 | ~234,000 | -36% | -46% | 5.8% |
| Q1 2026 | 216,399 | -27% | -7.8% | ~5.8% |
| Q2 2026 | 247,226 | -20.5% | +14.7% | ~5.8% |
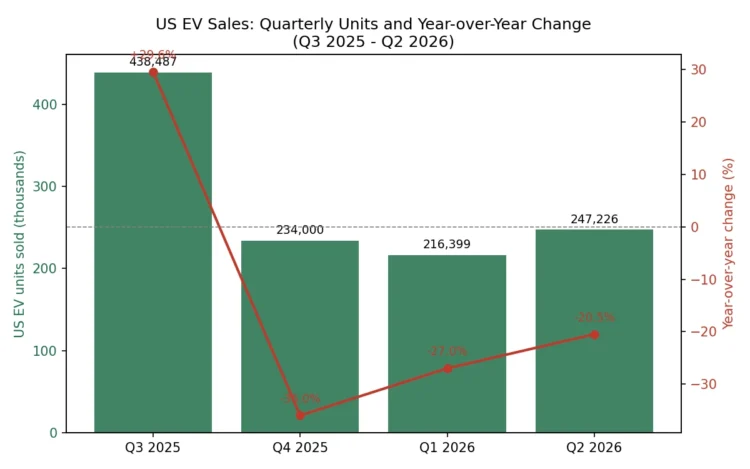
Bar-and-line chart showing US EV quarterly sales volume in thousands of units alongside year-over-year percentage change, from Q3 2025 through Q2 2026, illustrating the post-tax-credit sales correction and subsequent sequential stabilization.
Two patterns stand out. First, the year-over-year decline has narrowed in each of the last two quarters (-36%, then -27%, then -20.5%), even as the headline “sales are down” framing stays constant — the rate of decline, not just its direction, is the more informative number. Second, market share has been essentially flat at roughly 5.8% for three consecutive quarters after cratering from the 10.5% peak, suggesting the market found a new floor rather than continuing to erode.
On battery economics, BloombergNEF’s 2025 survey put the global volume-weighted average battery pack price at $108 per kilowatt-hour, an 8% year-over-year decline, with a further 3% decline to roughly $105/kWh forecast for 2026. The commonly cited price-parity threshold with gas vehicles is around $100/kWh — a level Chinese manufacturers have already crossed, while North American and European pack costs still run 44% and 56% higher than China’s, respectively (BloombergNEF, 2025).
Implications
Falling US EV sales figures, read in isolation, overstate how much ground electrification has actually lost. The more accurate reading is narrower and more useful: the specific $7,500 federal incentive was propping up a meaningful share of US EV demand, its removal produced a predictable and now-quantifiable correction, and the policy and cost structures that were pulling automakers toward electrification before the credit existed — state ZEV mandates, global battery cost declines, and export competition from China — are still fully in place.
For consumers, the practical implication is that EV affordability, not enthusiasm, is now the binding constraint on US demand. That’s visible in where growth is actually happening: Slate Auto’s stripped-down electric pickup, starting at $24,950 with 205 miles of range, has already drawn more than 180,000 reservations by undercutting the segment on price rather than range or tech. It’s also worth noting for buyers that the affordability calculus doesn’t stop at the sticker price — EVs depreciate faster than comparable gas vehicles, which changes the total-cost-of-ownership math now that the federal credit no longer offsets that gap at the point of sale.
For policymakers, the data suggests state-level ZEV mandates are doing more structural work than the now-expired federal tax credit ever did, since they constrain manufacturer behavior on a multi-year compliance timeline rather than a single purchase decision. For the industry, the write-downs at Ford, GM, and Stellantis reflect a repricing of how fast the EV transition will happen, not whether it will happen — hybrids are functioning as a financial bridge, funded partly by pausing battery capacity that companies are structuring to restart rather than permanently close.
Counterpoints and Limitations
This analysis has real boundaries worth stating plainly. It relies on estimated sales data from Cox Automotive and Kelley Blue Book rather than a single authoritative government registration count, and different data providers’ market-share figures diverge by half a percentage point or more depending on how they classify PHEVs and commercial fleet sales — a limitation flagged in the methodology note above. Two quarters of sequential improvement (Q1 and Q2 2026) is a short window; it is not long enough to confidently distinguish a genuine demand floor from a temporary plateau ahead of further decline, and this piece does not attempt a multi-year forecast.
The analysis also doesn’t resolve the central disagreement between the “recalibration” and “structural retreat” camps, because that disagreement partly hinges on questions this data can’t answer directly — how much of 2023–2025 EV demand was truly policy-induced versus organic, and whether ACC II-style mandates survive ongoing legal and political challenges. Readers should treat the comparative China and Europe data as directional context, not a controlled comparison; each market has a distinct incentive structure, consumer base, and regulatory history that limits how far the analogy extends. Finally, this piece focuses on the passenger vehicle retail market and does not separately examine commercial and fleet EV adoption, which follows different economics and could diverge from the consumer trend described here.
Conclusion
The evidence supports a specific, narrower claim than either “EVs are dying” or “nothing has changed”: US EV sales fell sharply because a specific $7,500 subsidy disappeared, that decline has been narrowing for two consecutive quarters, and the regulatory and cost structures that made automakers commit to electrification in the first place — state ZEV mandates, falling global battery prices, and Chinese and European competitive pressure — remain intact regardless of what happened to a single US tax provision. Automakers are pricing in a slower, choppier transition and funding it partly through hybrids, not abandoning the underlying bet.
The open question worth watching through the rest of 2026 is whether the state-level ZEV mandate framework proves as durable as the companies currently betting on it assume — because if that regulatory floor gives way, the “recalibration, not retreat” thesis loses its strongest supporting pillar.
FAQ
Why are US EV sales declining in 2026?
US EV sales are declining because the federal $7,500 tax credit expired on September 30, 2025, ending a subsidy that had pulled sales forward into Q3 2025’s record quarter. Sales dropped sharply after the deadline, but the year-over-year decline has narrowed each quarter since — from -36% in Q4 2025 to -20.5% in Q2 2026 — suggesting a stabilizing, not collapsing, market.
Will the federal EV tax credit come back?
There’s no indication the credit will return under current federal policy; the One Big Beautiful Bill Act that repealed it took effect for all purchases after September 30, 2025. Some states offer their own EV incentives independent of federal policy, and eligibility varies by state.
Are automakers cancelling their EV programs?
No major US automaker has cancelled its EV programs outright. GM, Ford, and Stellantis have delayed specific model launches, paused some battery-plant operations, and shifted near-term investment toward hybrids, while maintaining longer-term EV development to meet state ZEV mandate requirements.
Is China ahead of the US in EV adoption?
Yes. China accounts for roughly 51% of global EV sales versus a high-single-digit share for the US, and EVs make up nearly 55% of new car sales in China compared to roughly 5.8% in the US as of Q2 2026.